

I am often asked what metrics I look at as a CEO so I thought I’d share on the topic.
The profit loss (P&L) statement provides the foundation for the metrics I use, as it shows the money flow of the business. Pretty much every CEO monitors their P&L – but where it gets really meaningful is when segmentation is applied.
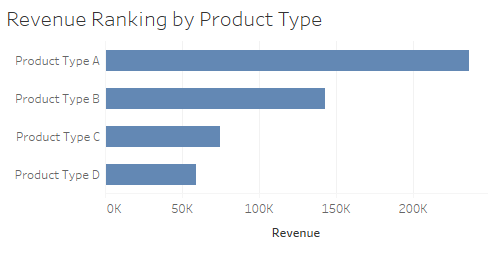
I start with revenue and slice it up by a variety of dimensions, such as service line, client type, individual client, and size of engagement. I seek to understand where the revenue is coming from, where we are growing most, and where we aren’t.
Then, expenses. I run a service business, so I look closely at team capacity, utilization, % billable by team members, and workload… and of course operating costs. I slice these metrics by the same dimensions I mentioned above. The allocation of cost to product, customer, business line etc is key to understanding profitability by these dimensions, which is where it gets tricky, and likely involves the CFO/controller/accountant.
If I can understand which products, business lines, customers are profitable and which are not, I can make very impactful decisions about which of those areas to emphasize and even which to eliminate.
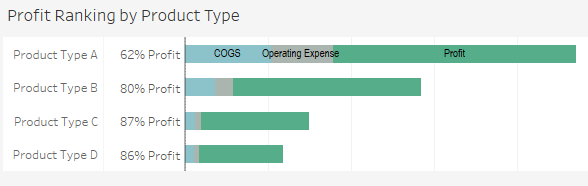
This chart shows each product type’s breakdown of total revenue into COGS, Operating Expense, Profit and which are most profitable in percentage terms.
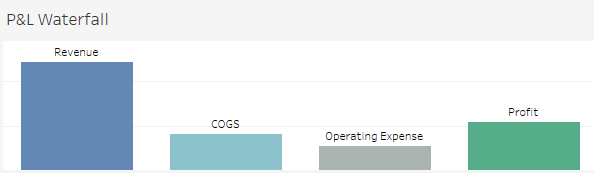
Another way of looking at this is a Profit & Loss Waterfall. It’s a visual way to follow the flow of money through the business. Reading left to right, we start with revenue, which is reduced by the amount of the next bar (COGS), then reduced again by the amount of the operating expense bar, leaving the remaining amount in the final bar…. profit or loss.
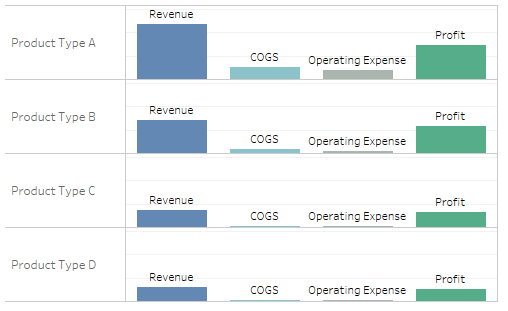
And here’s the power… the waterfall by segment, in this example, product type. Product Type A brings the most profit from a dollar standpoint, but in percentage terms, Product Type B wins. So, this suggests a strategy to grow Type B.
I’ll write on some other meaningful metrics in a future post. Spoiler alert, I’ll include things like sales pipeline conversion, average sales cycle time, marketing ROI, cost of sales, and utilization of my own time.